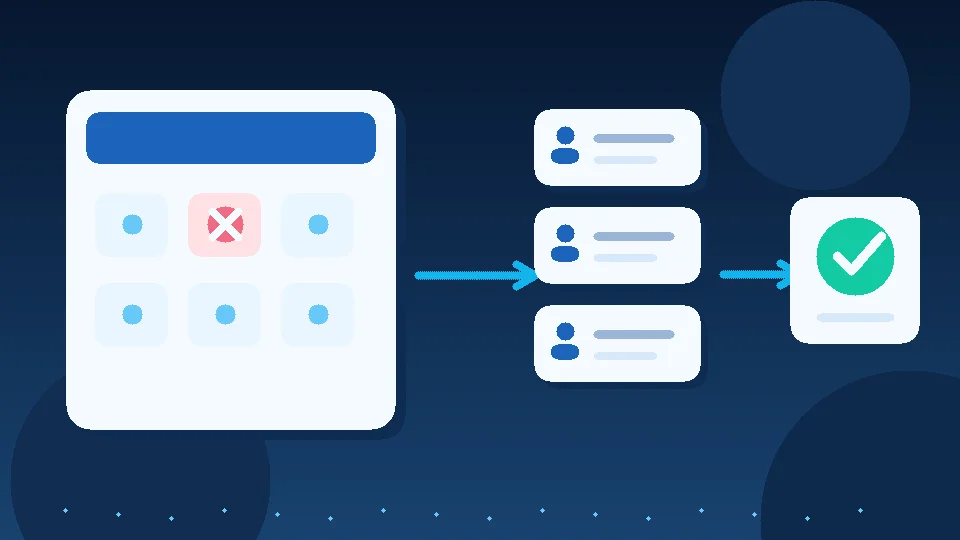

Your store brought in new orders this month, but you cannot tell whether first-time buyers came back. Before increasing ad spend, measure how many customers placed a second order within a realistic product-specific window, then check whether those orders contributed any money after variable costs. More orders alone do not answer the question.
Retention is not automatically a better investment than acquisition. Customers may stay away because delivery failed, product quality disappointed them, or the product simply has a long replacement cycle. The decision starts with a reliable measure, not the assumption that every non-returning customer represents a missed sale.
Measure second purchases for a defined cohort
Start with customers who made their first valid purchase in one particular month. That is a first-purchase cohort. Choose an observation window appropriate to the category, perhaps 90 days for a replenishable product and much longer for durable goods. The window is an analytical choice, not a universal benchmark.
90-day second-purchase rate = First-time customers in the cohort who completed a valid second order within 90 days / All eligible first-time customers in that cohort with a full 90 days of observation × 100.
A hypothetical example: 200 customers made their first purchase in January. Once all had a complete 90-day window, 30 of them completed a valid second order. The rate is 30 / 200 × 100 = 15%. This is an illustrative calculation, not an Egyptian industry average or a Mr. AI customer result.
Do not include someone who first purchased last week in a 90-day comparison. They have not had the same chance to return. Exclude cancelled or fully refunded orders from successful second purchases. If two orders appeared on the same day because of a checkout error, investigate whether they were genuinely separate purchases.
Distinguish a store-wide repeat customer rate, which compares repeat customers with all customers over a period, from the first-to-second-purchase conversion rate of a fixed cohort. The former is a useful overall signal. The latter answers the more actionable question: “Did the customers we acquired that month return?” Shopify's September 2026 customer engagement metrics guide explains repeat purchase measurement, while its May 2026 cohort analysis guide shows why blended averages can conceal changes between customer groups. These are global methodological references, not benchmarks for Egypt.
Prepare a useful dataset without building a huge analytics system
A clean export of completed orders can be enough. Include a stable internal customer ID, first valid order date, subsequent order dates, product category, order value after discounts, cancellation and refund status, and fulfillment cost if available. Keep personal information in your authorized systems. Use internal IDs for analysis rather than circulating phone numbers.
Only reconcile purchases made under different accounts or phone numbers when you have a reliable basis for identifying the same buyer. Do not merge two people because their names look similar, and do not automatically assume every phone number represents a different customer.
Build a small table by first-purchase month: eligible first-time customers, customers who placed a second order inside the window, the rate, and product categories that appear most often in second purchases. Compare cohorts with equally complete windows. For seasonal categories, compare comparable seasons rather than drawing conclusions from one month.
A second order generates revenue. Does it generate contribution?
A return rate does not tell you whether a retention campaign deserves its cost. Examine the contribution margin of second orders after product cost, discounts, packing, subsidized delivery, payment fees, messaging costs and expected returns. This is not the same as company net profit, which also includes fixed overhead.
Consider a completely hypothetical calculation. Thirty second orders at EGP 500 each produce EGP 15,000 in revenue before returns. If product cost is EGP 8,250, fulfillment and delivery EGP 1,350, discounts EGP 900, and outreach EGP 600, the remainder is EGP 3,900 of contribution before fixed costs and any uncounted costs or returns. It does not follow that a follow-up campaign caused EGP 3,900 of incremental contribution. Some customers would have returned without receiving a message.
To estimate the incremental effect, compare reasonably similar groups with a fair design and respect channel permissions. Our guide to testing follow-up against a comparison group explains why sales should not automatically be attributed to messages or the software.
When follow-up helps and when it backfires
For consumable products, a timely, useful replenishment reminder may make sense. But if the customer is still waiting for a delayed shipment or has an unresolved quality complaint, a promotional message can undermine trust.
Before sending WhatsApp marketing messages, verify appropriate consent and honor opt-out requests. The WhatsApp Business Messaging Policy, updated September 23, 2026, requires opt-in for business-initiated contact and respect for requests to stop. This is a channel requirement, not blanket permission for every follow-up. See our consent and opt-out workflow and replenishment reminder guide before launching.
If unreliable delivery is the real problem, improve fulfillment and order-status communication before sending more promotions. If your products are durable, referrals or complementary-category purchases may be more relevant than waiting for a second purchase of the same item.
Turn the first measurement into a decision
If second-purchase rates are weak alongside repeated delivery or quality complaints, fix the operating problem first. If customer experience is sound and products have a clear replenishment cycle, test a small permission-based follow-up and compare contribution with the cost of reaching customers. If the category has a naturally long purchase cycle, do not judge your marketing team on an unsuitable short-term metric. Measure customer quality and profitability over a longer horizon.
Where does Mr. AI fit? According to the current product FAQ, it supports knowledge-based replies, configured follow-up, conversation summaries and human handoff. Those functions can help maintain useful post-purchase conversation context. Do not assume Mr. AI automatically imports ecommerce order history, calculates cohorts or contribution margin, or attributes revenue to campaigns. Financial analysis and order linkage require your own verified data and appropriate tools.
Start with one first-purchase cohort whose observation window is complete. Once you can explain how many returned, what may have influenced them, and whether the second order contributed financially, you have a defensible choice: fix the purchase experience, test a limited follow-up, or invest in acquiring more new customers. Without those answers, increasing ad spend is an unmeasured bet.